lightbulb
Short answer
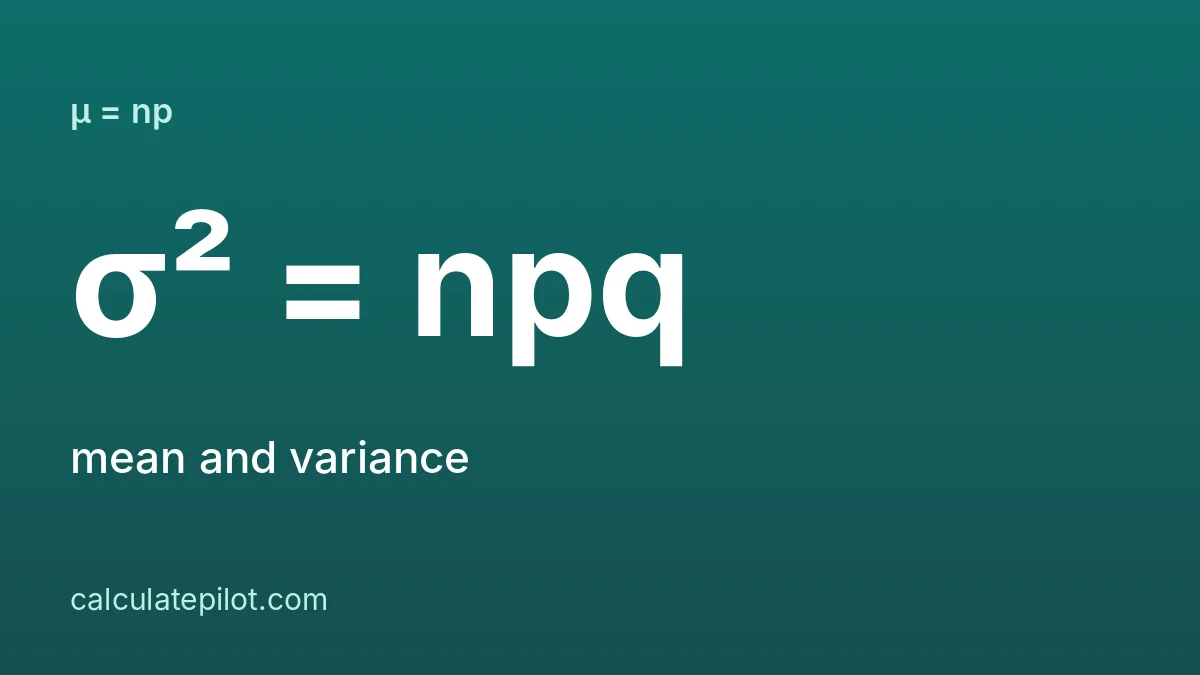
For a binomial distribution the mean is np, the variance is np(1 − p) and the standard deviation is the square root of the variance. For n = 100 and p = 0.5 they are 50, 25 and 5.
1. Formulas
- Mean: μ = np
- Variance: σ² = np(1 − p)
- Standard deviation: σ = √(np(1 − p))
2. Worked examples
| n | p | Mean | Variance | Std dev |
|---|---|---|---|---|
| 100 | 0.5 | 50 | 25 | 5 |
| 50 | 0.02 | 1 | 0.98 | 0.9899 |
| 30 | 0.7 | 21 | 6.3 | 2.5100 |
| 20 | 0.25 | 5 | 3.75 | 1.9365 |
3. What they mean
- The mean is the expected number of successes: with 30 patients and a 70% response rate, expect 21.
- The variance never exceeds the mean, because 1 − p is at most 1.
- For a fixed n, the variance is largest at p = 0.5.
4. Using it for approximations
When np and n(1 − p) are both large, the distribution is close to a normal curve with these mean and standard deviation. For n = 100 and p = 0.5, P(X ≤ 55) is 0.864373 exactly and 0.864334 using the normal curve with continuity correction.
The Binomial Probability Calculator reports the mean, variance, standard deviation, skewness and kurtosis for any n and p. See also how to calculate binomial probability and the general Standard Deviation Calculator.
5. Frequently asked questions
What is the mean of a binomial distribution?expand_more
np, the expected number of successes.
What is the variance of a binomial distribution?expand_more
np(1 − p).
Is the variance ever bigger than the mean?expand_more
No. The variance is np(1 − p), which is at most np.
What is the standard deviation for n = 100 and p = 0.5?expand_more
√25 = 5.