Short answer
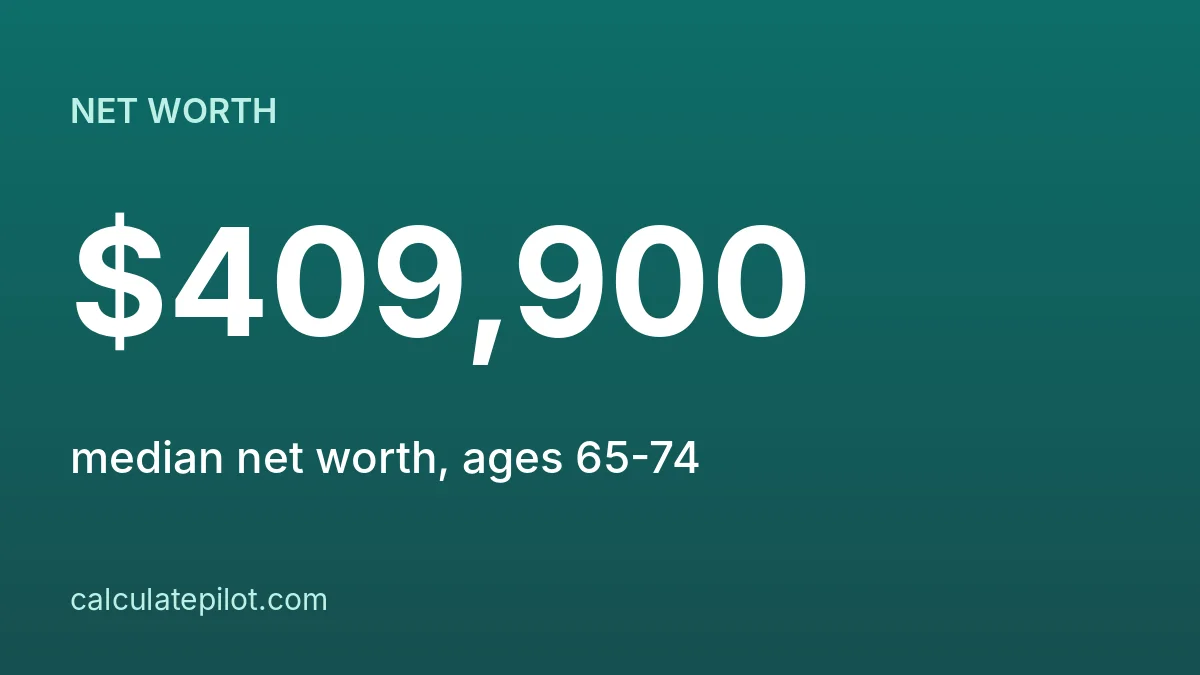
Median US net worth rises from $39,000 for families under 35 to $409,900 at ages 65-74, then dips to $335,600 after 75. The mean is about four times higher in every group, so compare yourself with the median.
1. Median and mean by age
Net worth is assets minus debts. Federal Reserve Survey of Consumer Finances, 2022, by age of the head of the family:
| Age of head of family | Median | Mean | Mean ÷ median |
|---|---|---|---|
| Under 35 | $39,000 | $183,500 | 4.7× |
| 35–44 | $135,600 | $549,600 | 4.1× |
| 45–54 | $247,200 | $975,800 | 3.9× |
| 55–64 | $364,500 | $1,566,900 | 4.3× |
| 65–74 | $409,900 | $1,794,600 | 4.4× |
| 75 or more | $335,600 | $1,624,100 | 4.8× |
2. Why the mean is so much higher
A small number of very wealthy families pull the mean up. Half of families are below the median by definition, so it describes the typical family better.
3. How to use this
- Compare your net worth with the median for your age group, not the mean.
- Being below the median at a young age is common because of student debt and early-career pay.
- Home equity and retirement accounts are a large part of the median family's net worth.
- These tables do not give percentiles, so this is a comparison with the middle, not a ranking.
Enter your numbers in the Net Worth Calculator to see where you sit against these benchmarks. For a rule-of-thumb target, see the Millionaire Next Door formula.
4. Frequently asked questions
What is the average net worth by age in the US?expand_more
In 2022 the median ranged from $39,000 (under 35) to $409,900 (65-74) and the mean from $183,500 to $1,794,600, per the Federal Reserve.
Should I compare myself to the mean or median?expand_more
The median. A few very wealthy families raise the mean to roughly four times the median in every age group.
Why does median net worth fall after 75?expand_more
Households often draw down savings in retirement, so the median falls to $335,600 in the 75+ group.
Does this show my percentile?expand_more
No. The Fed's age table gives median and mean only, not a percentile ranking.